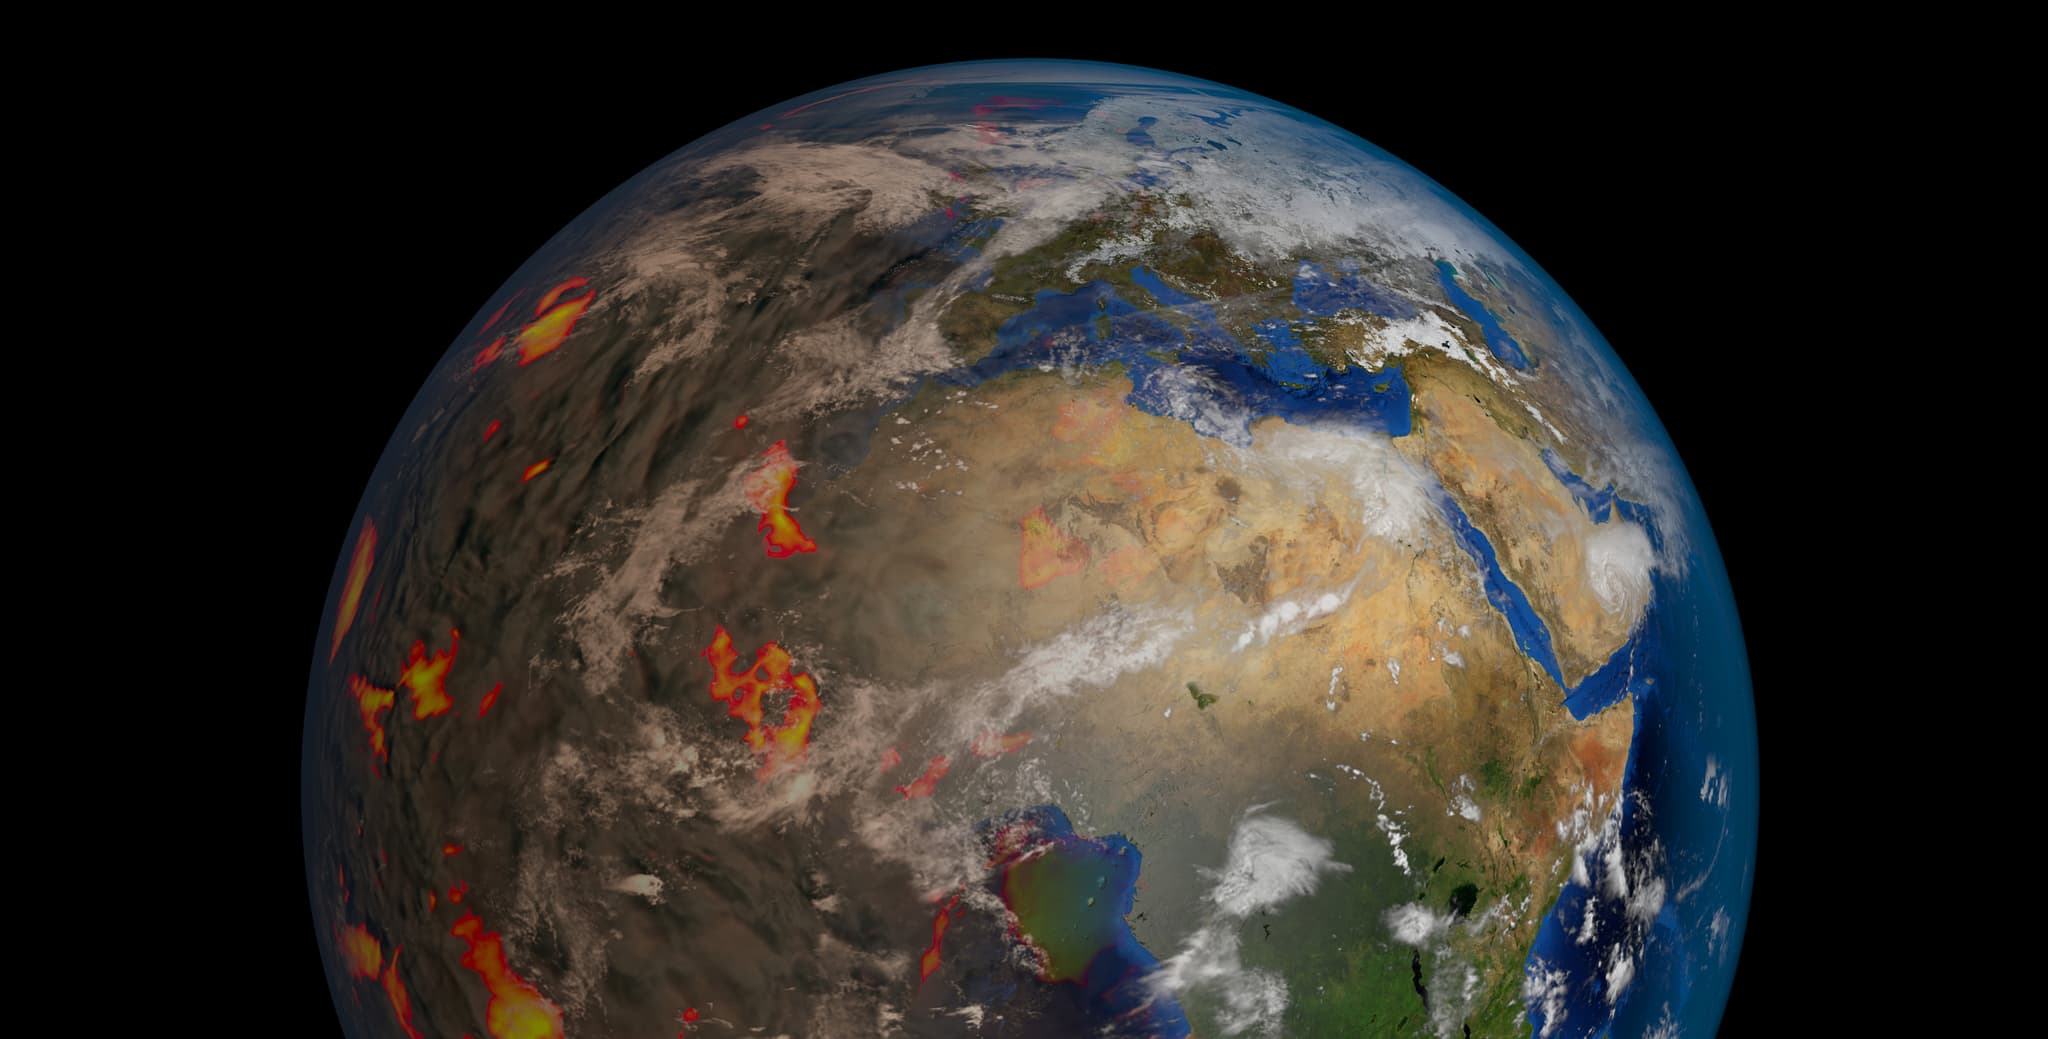
Case study map
Our case study map offers a graphic representation of disaster recovery on a global scale.

More than 100 case studies, mainly occurring in the last 30 years, are currently logged. These disaster studies vary in size, in geography and the income levels of the communities impacted. Each case study includes data on the quality and speed of the recovery process, both social and economic, as well as the source and efficacy of capital funding. By changing layers and markers you can compare different events and their impact globally. For more information on individual disasters visit our case study catalogue.
Explore the research

Case study catalogue
Our case study catalogue offers an empirical perspective on disaster recovery on a global scale.
Discover more
Database analysis
Our data visualisations illustrate the relationship between recovery speed, quality, availability of relief funds and insurance capital protections.
Discover more